Survey Shows What We Drive Reveals Political Preference
A new survey from Total Car Score (www.totalcarscore.com) suggests a relationship between what people drive and how they’ll vote on Election Day.
A Facebook survey of more than 600 participants from across the U.S., identified as either Democrats/Liberals or Republicans/Conservatives, allowed respondents to select the type of vehicle they drive, revealing clear differences in the driving preferences for each political orientation.
The complete results of the survey can be found on Total Car Score’s website: Among the primary findings:
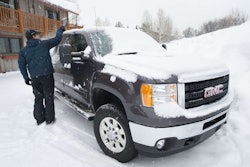
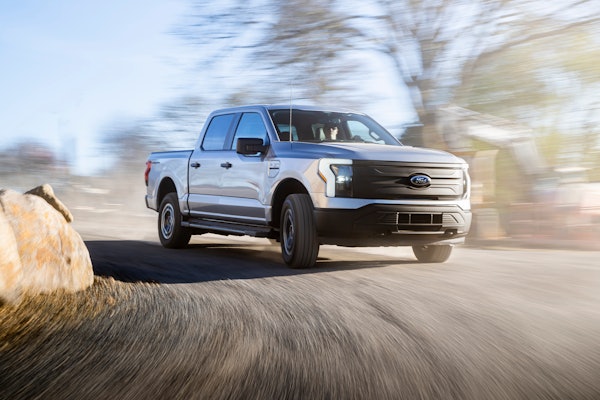
- 29% of consumers identified as Republicans/Conservatives report driving a Truck.
- 27% of participants identified as Democrats/Liberals report driving Economy/Compact Cars.
- Hybrid/Alternative-Fuel vehicles are the among the least-popular segments with both groups
- SUVs/crossovers are favored about equally: 20% for Republicans/Conservatives versus 18% for Democrats/Liberals.
Despite differences in the number one vehicle type for Republicans and Democrats, the survey also reveals some interesting similarities between the two groups of voters.
“While the most popular vehicle type for each political group is very different, the SUV/Crossover segment is the second most-driven vehicle category for both Republicans (20%) and Democrats (18%),” said Karl Brauer, Editor-in-Chief of Total Car Score.
“This explains why the SUV/Crossover segment has grown so much over the past 12 years. This segment has successfully crossed party lines and brought the two groups together — far more successfully than the many politicians who claim to have that skill set.”
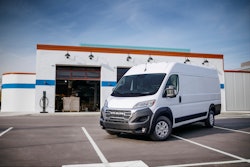
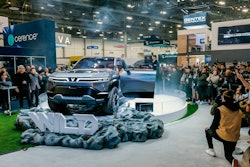
Also, in what may come as a surprise, the Hybrid/Alternative-Fuel segment ranks low for consumers of both political parties, coming in last place for Democrats and second-to-last place for Republicans, just above the Van/Minivan segment.
However, at 6% market share among Democrat drivers the Hybrid segment is more than twice as popular with Democrats than it is with Republicans, who drive hybrids only 2.7% of the time.